 Skip to content

How to Read Nautical Charts: A Complete Mariner's Guide
Learning to read a nautical chart really just comes down to understanding a handful of key pieces: the chart's scale and general information, its latitude and longitude grid, the water depths, and all the little symbols for hazards and aids to navigation. Once you get the hang of these, what looks like a confusing map suddenly becomes your most trusted guide at sea.
Your First Look at a Nautical Chart
Alright, let's get our bearings. A nautical chart is so much more than a simple map of the water. It's a highly specialized tool, packed to the gills with information that's absolutely vital for getting from Point A to Point B safely. Even with all the fancy GPS units we have today, knowing your way around a paper chart is a non-negotiable skill for any mariner.
Think of this first look as learning the language of the sea. We'll kick things off by exploring the essential info you'll find in the margins and the title block—this is the context you need for everything else on the page. Getting comfortable here builds the foundation for navigating with real confidence.
The Chart's Title Block
The first place your eyes should go on any new chart is the title block. It's usually tucked into an open area of the chart and basically acts as its biography, telling you everything you need to know about its purpose and limitations.
Here’s what you’ll find there:
- Chart Title and Region: This tells you the specific geographical area the chart covers, like "Approaches to Narragansett Bay."
- Chart Number: Every official chart has a unique number (for example, NOAA Chart 13218). This is how you find and order the exact chart you need.
- Publication Date and Edition: This is a big one for safety. It tells you when the chart was printed and its edition number, which helps you figure out if your chart is dangerously out of date.
- Projection Type: Most navigation charts use the Mercator projection. The key thing to know is that this projection lets you plot your course as a simple straight line.
Key Takeaway: Always, always check the title block first. It gives you the foundational context—what you're looking at, how old it is, and the units of measurement—that you absolutely need to interpret the rest of the chart correctly.
Understanding Scale and Depth Units
The chart's scale, which you'll see written as a ratio like 1:80,000, shows you the relationship between a distance on paper and the actual distance on the water. A chart with a larger scale (say, 1:20,000) shows a smaller area but with much more detail, which is perfect for navigating tight harbors. A smaller scale chart (like 1:200,000) covers a huge area with less detail, making it better for general coastal sailing.
Just as important are the depth units, which are printed loud and clear on the chart. Depths can be shown in feet, fathoms (one fathom is six feet), or meters. I can't stress this enough: misreading this single piece of information can lead to a very bad day. Always confirm the depth unit before you even think about planning a route.
This whole system of mapping the seas has a fascinating history. The very first specialized maritime maps, known as Portolan charts, popped up around 1270 to help sailors cross the Mediterranean. This knowledge grew over the centuries, with hydrographic offices in France, Great Britain, and later Germany standardizing how charts were made to make global navigation safer for everyone. You can actually read more about this history over at the German Federal Maritime and Hydrographic Agency.
Whether you’re relying on a modern chartplotter or a trusty paper chart, you need a good source for your maps. If you're looking for some solid options, you might want to check out our guide on sites to get fishing charts or marine maps online. After all, knowing where to find reliable charts is the first real step of any voyage.
Interpreting Latitude, Longitude, and Scale
Alright, let's get into the real meat and potatoes of chart reading: the grid system that tells you where you are and how far you need to go. This grid, a web of latitude and longitude lines, is the absolute foundation of all navigation. Once you get the hang of it, and understand how chart scale works, that confusing page of lines and numbers transforms into a powerful, precise tool for getting you safely from A to B.
It's easy to take for granted, but the ability to pinpoint a location with this kind of accuracy is built on centuries of brilliant minds and hard-won lessons at sea. The game really changed back in the 16th and 17th centuries when mathematics and astronomy collided, turning chart reading from a rough art into a genuine science. A huge leap forward was Edward Wright’s 1599 work that finally explained the math behind the Mercator projection, which lets us plot a ship's course as a simple straight line. You can dive deeper into these historical advancements in navigation that shaped the very charts we use today.
Finding Your Position with Latitude and Longitude
Think of latitude and longitude as the Earth’s personal address system. Every single spot on the water has a unique coordinate, and your chart is the map that shows you exactly where that address is. These coordinates are broken down into degrees (°), minutes (‘), and seconds (“).
- Latitude (Lat) lines are the horizontal ones, running parallel to the equator. They tell you your position north or south. You'll always find the latitude scale printed on the left and right sides of your chart.
- Longitude (Long) lines are the vertical ones, running from the North Pole to the South Pole. These tell you how far east or west you are from the Prime Meridian. The longitude scale is always found on the top and bottom of the chart.
So, how do you find your position? Let's say your GPS gives you Lat 41° 53’ 22” N, Long 87° 35’ 26” W. You'd grab a straight edge, line it up horizontally with 41° 53’ 22” N on the side scale, and then use another ruler to draw a vertical line down from 87° 35’ 26” W on the top scale. Where those two lines cross? That's you.
Why Chart Scale Matters
The scale of your chart, which you’ll find in the title block as a ratio like 1:80,000, is absolutely critical. It’s not just about numbers; it’s about safety and having the right level of detail for the job at hand. A smaller number after the colon means a larger scale, which translates to more detail over a smaller area.
You'll find yourself switching between different scales throughout a single trip:
- Harbor Charts (e.g., 1:20,000): These are your large-scale, close-up charts. They show a small area in immense detail. You absolutely need these for navigating tight channels, picking out individual buoys, and finding your way to a specific dock in a crowded harbor.
- Coastal Charts (e.g., 1:80,000): This is your workhorse for navigating along the coast. It’s a medium-scale chart that balances detail with broader coverage, showing you key land features, major shipping channels, and offshore hazards.
- General or Sailing Charts (e.g., 1:200,000 or smaller): When you're heading offshore, you'll switch to these small-scale charts. They cover huge stretches of open water and are perfect for planning long passages where you don't need to know about every single rock and shoal along the way.
Pro Tip: Never, ever try to enter a harbor using a small-scale coastal chart. You’re effectively sailing blind. You won't see the specific dangers like submerged rocks or shallow spots that are only visible on a detailed harbor chart. Always switch to the largest scale chart available for your immediate area. It's a non-negotiable rule of safe boating.
Measuring Distance in Nautical Miles
One of the most practical skills you'll learn is measuring distance right off the chart. On a Mercator chart, there's a handy rule: one minute of latitude is always equal to one nautical mile (1 NM), which is about 1.15 statute miles (the kind you use on land).
This is why the latitude scale on the sides of your chart doubles as your ruler.
To measure the distance between two points, grab your dividers.
- Place one point of the dividers on your starting position and the other on your destination.
- Carefully, without changing the spread, move the dividers over to the latitude scale on the side of the chart.
- The number of minutes your dividers span is the distance of your route in nautical miles. It’s that simple.
A word of warning: Never use the longitude scale at the top or bottom of the chart to measure distance. Because those longitude lines get closer together as they approach the poles, the distance between them changes depending on how far north or south you are. The latitude scale, however, is your constant, reliable source for measurement.
Reading Depths and Underwater Hazards
Of all the skills you need on the water, understanding what's under your boat is probably the most important. A nautical chart isn't just a piece of paper; it's a three-dimensional guide to the seabed. Learning to read its language of depths and dangers is what separates a prepared skipper from a future cautionary tale.
This isn't new, of course. For centuries, mariners have relied on charts to avoid disaster. From a 1775 chart of the River St. Lawrence that painstakingly detailed every known rock, to the harbor chart books that became the bible for early 20th-century sailors, these tools have always been about one thing: getting home safely.
Decoding Depth Soundings and Contour Lines
The first thing you’ll notice are the numbers scattered across the water—these are the soundings. They tell you the depth from a specific low-water level right down to the seabed. Before you even think about what they mean, find the chart's title block and see if the depths are in feet (ft), fathoms (fms), or meters (m). Getting this wrong is a classic, and potentially catastrophic, rookie mistake.
To give you a feel for the terrain, charts use depth contour lines, also called isobaths. Just like on a topographic map, these lines connect points of equal depth.
- A line marked "10" traces a path where the water is exactly ten units deep.
- Contour lines packed tightly together signal a steep underwater cliff or seamount.
- Lines that are far apart mean you're looking at a gentle, gradual slope.
- Charts often use color to help, too. Lighter shades of blue typically mean shallower water, while deeper water is left white.
Tracing these contours with your finger helps you build a mental map of underwater ridges and valleys, which is key for finding safe channels or a good spot to drop anchor.
Understanding the Chart Datum
So, what exactly is this "low-water level" we're talking about? This is where the chart datum comes in. It’s the baseline, the zero-point from which all depths on that specific chart are measured. In the United States, this is usually Mean Lower Low Water (MLLW), which is the average of the lower of the two low tides that happen each day.
Using MLLW is a conservative approach. It means the number you see on the chart is almost always the least amount of water you can expect to find there. But remember, the actual depth is always changing with the tide.
Crucial Insight: The depth on the chart isn't the depth right now. It's the depth at MLLW. To get the real-time depth, you have to take the charted depth and add the current tide height from a tide table.
Identifying Underwater Hazards
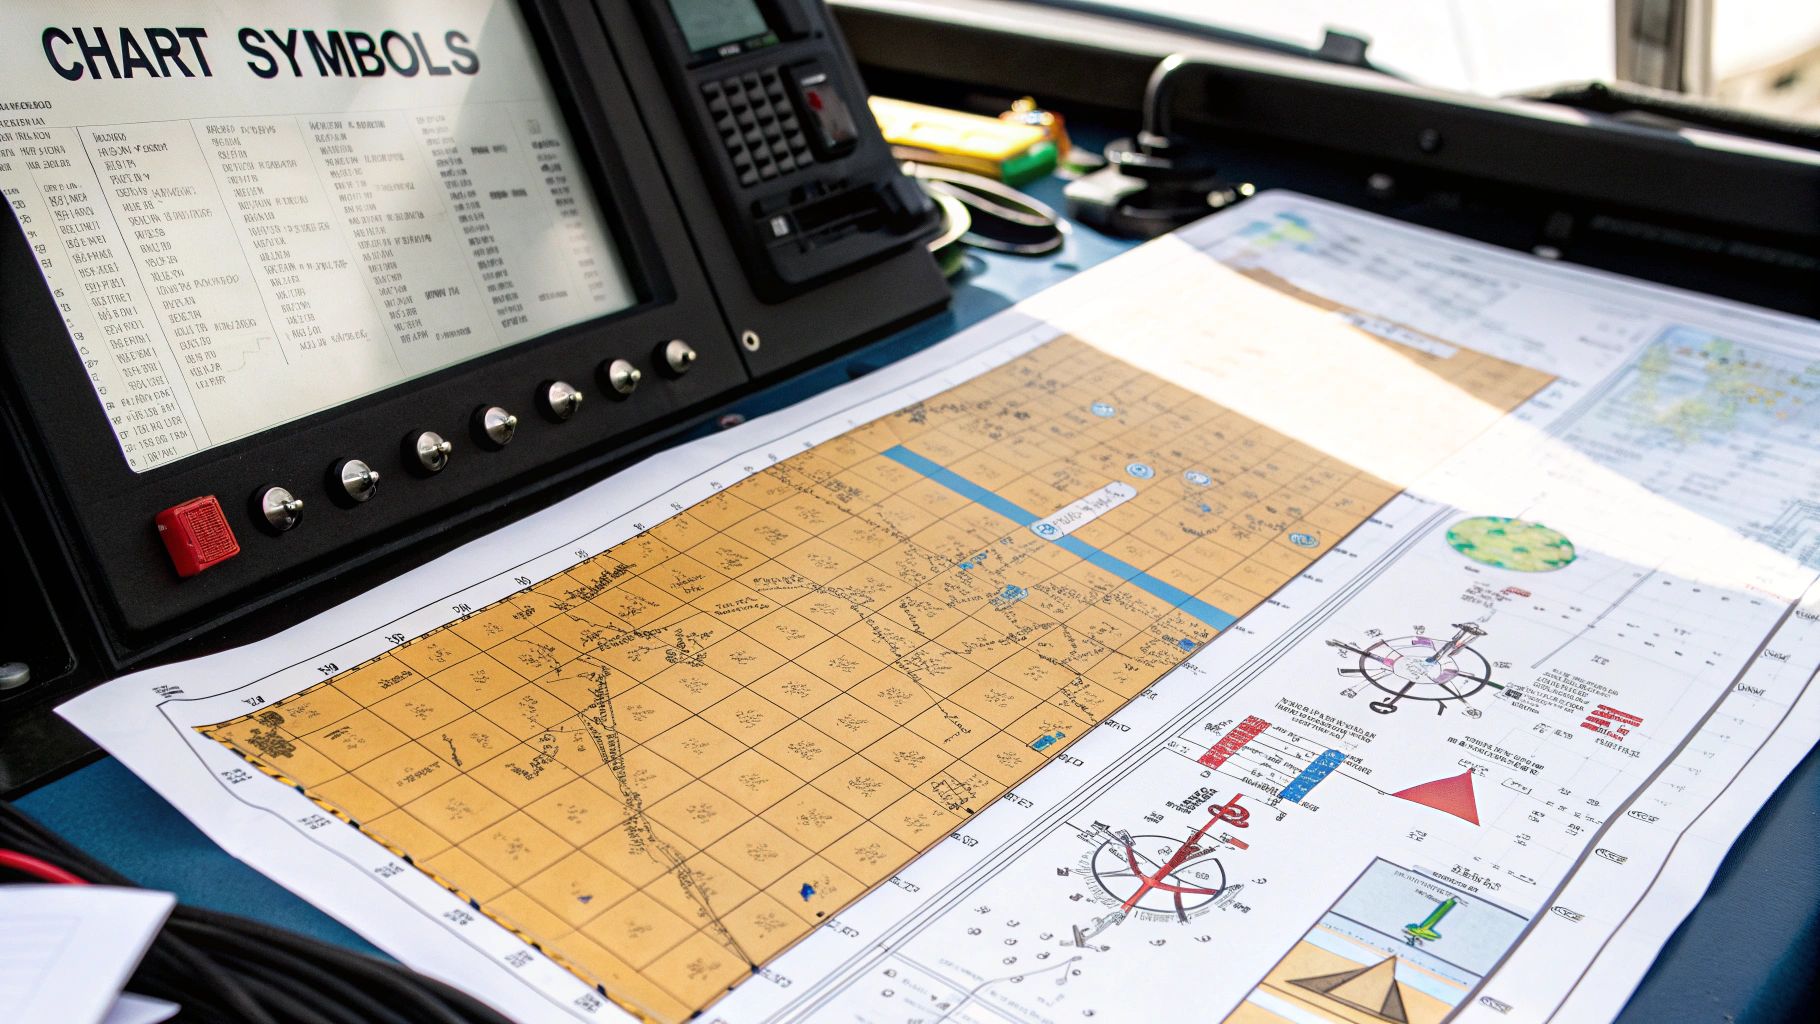
Beyond just running aground, your chart is your first line of defense against all the nasty things you can hit. These hazards are marked with specific symbols and abbreviations that you absolutely must learn to recognize on sight.
Here are a few of the big ones you'll encounter:
| Hazard Symbol/Abbreviation | What It Means | Action to Take |
|---|---|---|
Rk or a * symbol |
A rock or rocky area. | Give it a wide berth. A + symbol means the rock is always submerged. |
Wk or a .. symbol |
A wreck. | Steer clear. A dotted outline shows a submerged wreck that's a hazard to navigation. |
| Reef or jagged lines | A coral or rocky reef. | Avoid completely. These are often large and extremely shallow. |
| Obstn | An obstruction of an unknown nature. | Treat it like a solid wall. Assume it’s a danger and stay far away. |
Knowing these symbols is just as critical as keeping your engine maintained. Ignoring either one can put a very abrupt end to your boating season. Speaking of which, good maintenance habits start with proper off-season care. If you need a refresher, check out our detailed guide on how to winterize a boat. This kind of attention to detail—both on your charts and in your engine bay—is the hallmark of a truly skilled mariner.
Decoding Aids to Navigation and Symbols
Just like roads have signs and traffic lights, the waterways have their own language to keep mariners safe. This system is made up of Aids to Navigation (AtoNs)—a collection of buoys, beacons, and lights designed to keep you in safe water and guide you away from hidden dangers. Being able to read these symbols on your chart is one of the most fundamental skills you can develop.
At the heart of this system is the IALA Maritime Buoyage System. IALA stands for the International Association of Marine Aids to Navigation and Lighthouse Authorities, and they created a standardized system for the entire globe. But there's one big catch you need to know about: the world is split into two different regions.
The Two Worlds of IALA Buoyage
The globe is divided into two primary buoyage regions: Region A and Region B. While many of the buoy shapes and light patterns are identical, the color system for the buoys marking the edges of channels—called lateral marks—is completely reversed.
- Region B covers North, Central, and South America, plus Japan, South Korea, and the Philippines.
- Region A is essentially the rest of the world, including Europe, Africa, Australia, and most of Asia.
Knowing which region you're sailing in is absolutely critical. In the United States (Region B), a popular mnemonic is "Red, Right, Returning," meaning you keep the red buoys on your starboard (right) side when you’re heading in from the sea. Try that in Europe (Region A), and you’ll quickly find yourself in trouble, as the colors are swapped.
Here's a quick reference to keep the two systems straight.
IALA Buoyage Systems at a Glance
| Feature | IALA Region A (Most of World) | IALA Region B (The Americas, Japan, Korea, Philippines) |
|---|---|---|
| Port Hand (Left Side) | Red Cans | Green Cans |
| Starboard Hand (Right Side) | Green Cones ("Nuns") | Red Cones ("Nuns") |
| Returning from Sea | Keep red buoys to port. | Keep red buoys to starboard ("Red, Right, Returning"). |
| Heading to Sea | Keep green buoys to port. | Keep green buoys to starboard. |
This might seem confusing at first, but it boils down to one simple difference: the colors for port and starboard are swapped. Once you know which region you're in, the rest of the system's logic falls into place.
Lateral Marks Defining the Channel
The most common AtoNs you'll encounter are lateral marks. These are your bread and butter for staying in the safe part of a channel. In Region B (the Americas), it works like this:
- Red "Nun" Buoys: These are conical (cone-shaped) and always have even numbers. They mark the right side of the channel as you return from the open sea.
- Green "Can" Buoys: These are cylindrical (like a soup can) and have odd numbers. They mark the left side of the channel when returning.
A handy trick for remembering the shapes is that the cone shape of a nun buoy looks a little like a traditional nun's habit. On a paper chart, these buoys show up as small diamonds (or triangles for nuns) colored red or green, usually with their number printed right beside them.
Cardinal Marks Keeping You Safe From Danger
While lateral marks guide you along a safe route, cardinal marks are all about keeping you away from a specific hazard. They tell you which direction—North, East, South, or West—is the safe side to pass a danger like a submerged rock or a wreck.
A Mariner's Lifesaver: Cardinal marks are incredibly useful. Imagine you spot a wreck on your chart. A North cardinal mark placed just north of that wreck is a clear instruction: pass to the north of this buoy, and you'll stay in safe water.
Each cardinal mark has a unique color scheme and a top-mark made of two black cones, making them easy to identify from a distance.
- North: Black over yellow. Both cones point up (like the North Pole).
- East: Black with a yellow band. Cones point away from each other (like an egg).
- South: Yellow over black. Both cones point down (like pointing south).
- West: Yellow with a black band. Cones point towards each other (like a wine glass or a "W" for West).
On a chart, you’ll see the buoy symbol with an abbreviation like "BYB" (Black-Yellow-Black), which instantly tells you it’s an East mark. They also have distinct flashing light patterns at night based on a clock face. An East mark, for example, flashes three times in a row, corresponding to the 3 o'clock position.
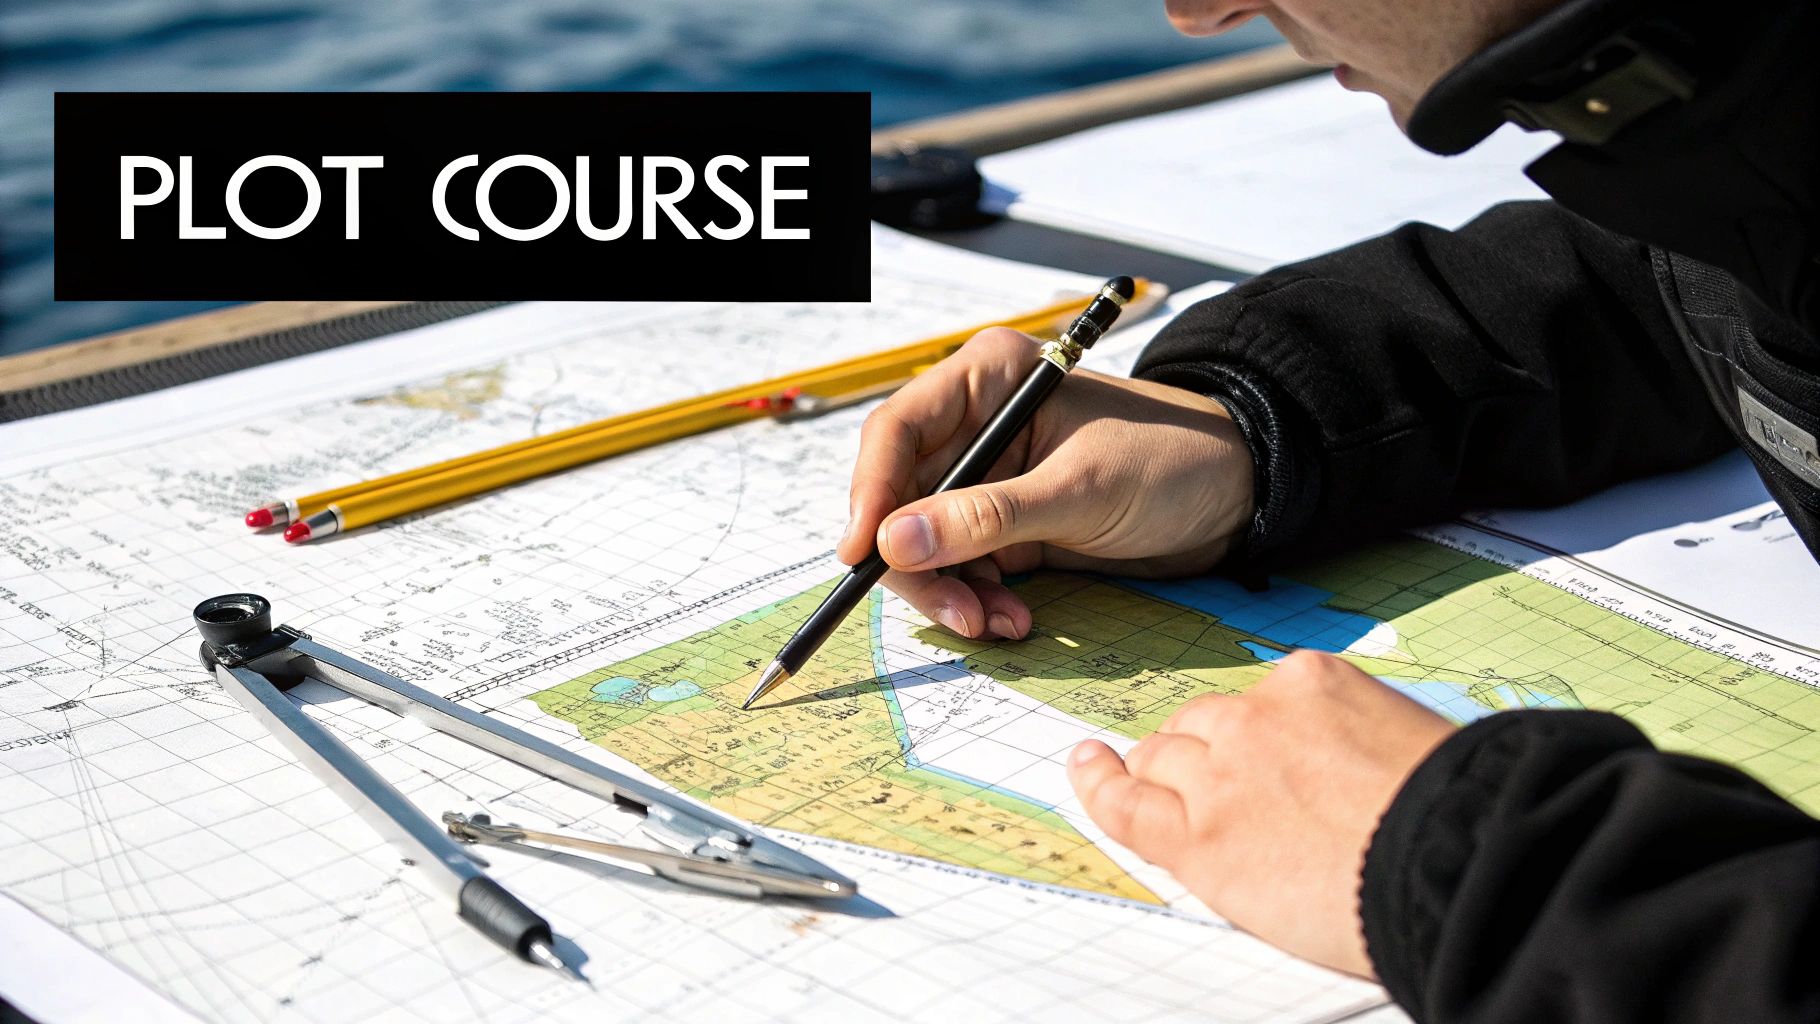
Putting It All Together by Plotting a Course
You’ve learned the language of the chart—depths, symbols, latitude, longitude—and now it's time to put it all into practice. This is where we move from theory to the real world at your chart table, planning a safe and efficient voyage. Plotting a course is the hands-on skill that turns you from a chart reader into a confident navigator.
This isn't just about drawing a line from Point A to Point B. It's a thoughtful exercise where you anticipate challenges, find safe water, and build a reliable plan for your trip. Before you start, grab your tools. You'll need a sharp pencil (and a good eraser), a set of parallel rulers, and a pair of dividers. There's a reason this trio has been the standard for paper chart navigation for generations—it just works.
Laying Down Your First Course Line
Let's walk through a classic scenario: you're planning a day trip from your harbor, around a rocky headland, to a quiet cove for lunch. Your first move is to find your start and end points on the chart. Now, take a hard look at the water between them. Are there any obvious dangers like wrecks (Wk), submerged rocks (Rk), or shallow reefs?
With your parallel rulers, draw a light, straight line connecting your start and end points. Think of this as your "perfect world" route. Now, you need to be your own safety inspector.
- Does this line cross over land?
- Does it take you through dangerously shallow water, marked by those blue-tented areas or low depth numbers?
- Does it skim too close to any known obstructions or hazards?
If you answered yes to any of these, you'll need to create a dog-leg in your course. This just means adding one or more intermediate waypoints to steer around the danger. Draw new lines connecting your start to your first waypoint, then that waypoint to the next, until you have a clear path to your destination. Each of these straight-line segments is a "leg" of your journey.
From a Line to a Number: Measuring Bearing and Distance
With a safe route penciled in, it’s time to turn those lines into numbers you can actually use. For each leg, you need two key pieces of information: the true bearing and the distance.
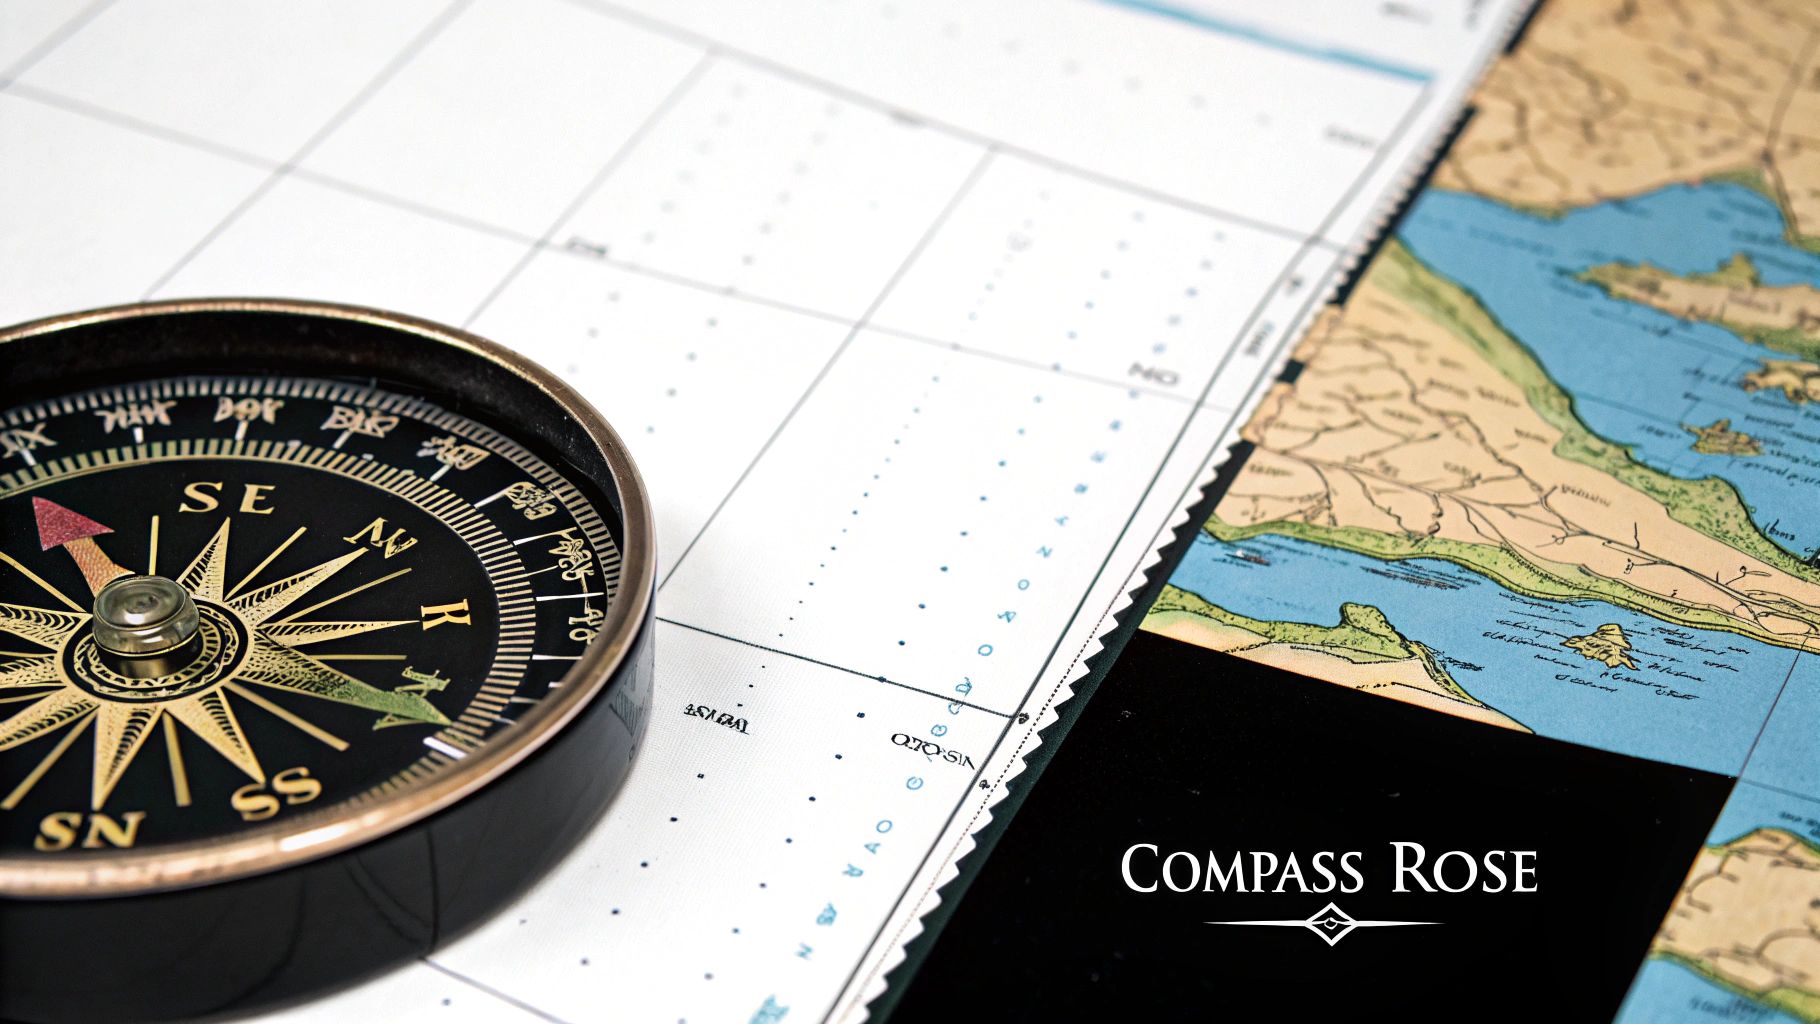
To get the true bearing, you "walk" your parallel rulers from the course line over to the nearest compass rose on the chart. Be precise and make sure the ruler's edge cuts right through the center point. Where the ruler crosses the outer ring (the true north ring), that's your course in degrees. For instance, your first leg might be 095° True.
Next up is distance. Use your dividers to measure the length of that same leg. Place one point of the dividers at the start of the leg and the other at the end. Without changing that spread, move the dividers over to the latitude scale running up the side of the chart. And remember this crucial rule: one minute of latitude equals one nautical mile. If your dividers cover 4.5 minutes on the scale, your leg is 4.5 nautical miles long.
Navigator's Log: A great habit to get into is writing the true course and distance directly on the chart, right above the course line. Something like "T 095° | 4.5 NM" keeps everything you need in one place, making it easy to glance at when you're underway.
This whole process starts with being able to visualize the seabed from the chart. This infographic breaks down how to turn that raw data into a mental map of what's happening under your boat.
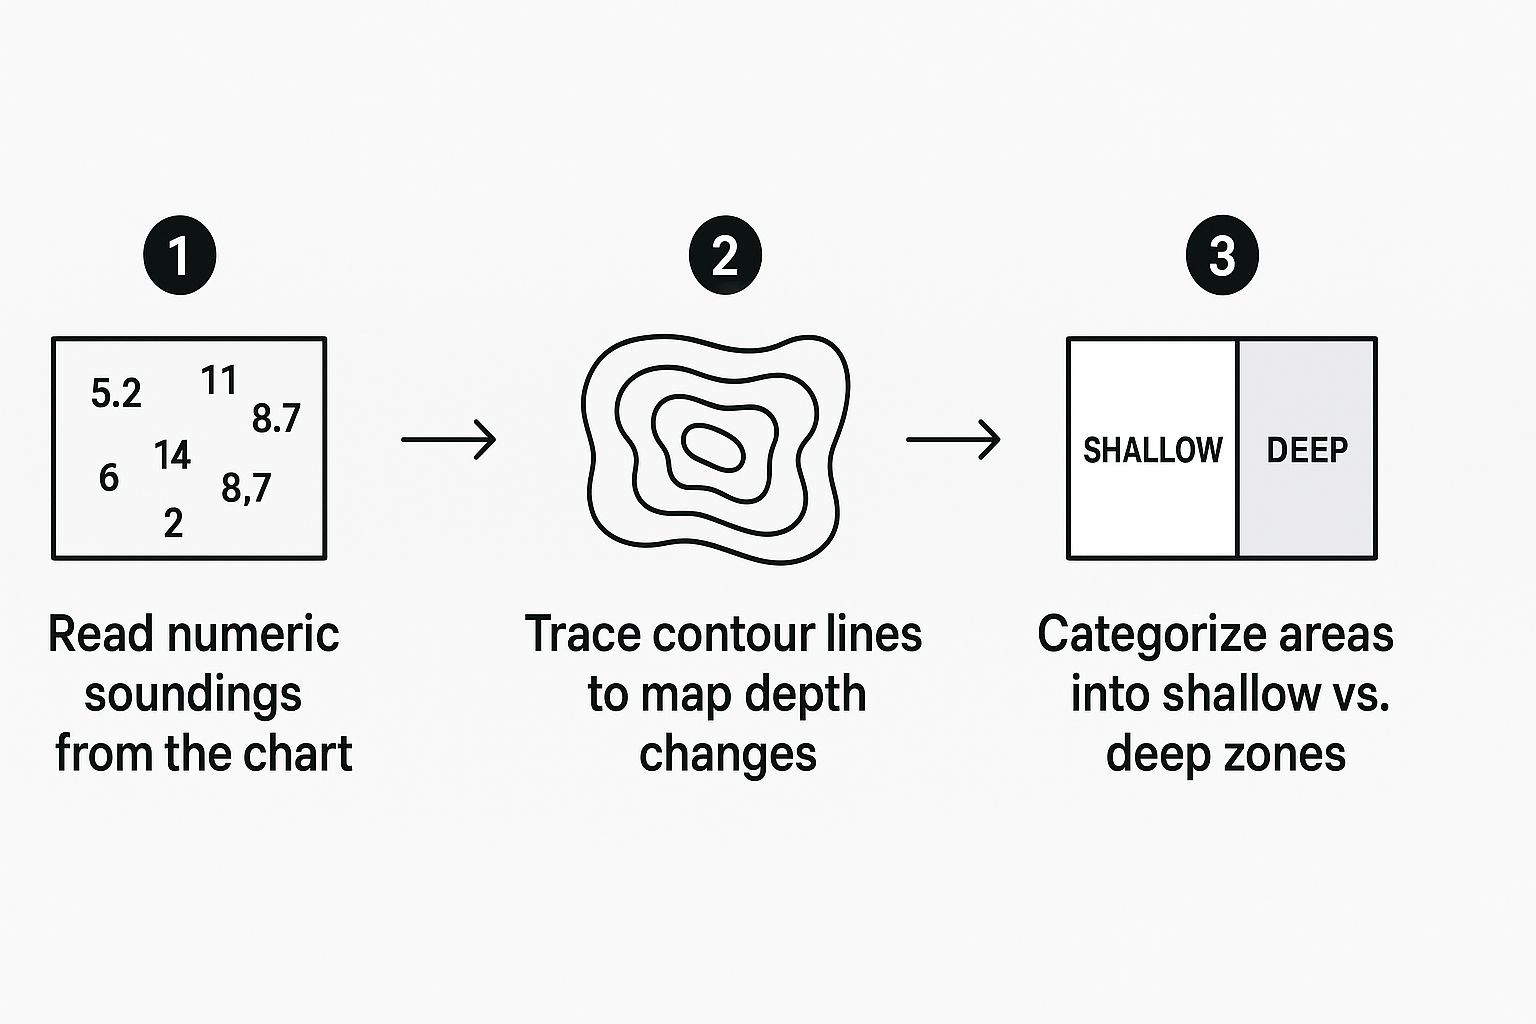
This method of checking soundings, following contour lines, and noting colored zones helps you spot safe channels and grounding risks before you even draw your first line.
Accounting for the Real World: Set and Drift
The course you plotted is a perfect line, but out on the water, your boat will almost never travel perfectly along it. You’ve always got wind and current pushing you around. We call this combined effect set (the direction of the push) and drift (the speed of the push).
To figure out the estimated set and drift for your trip, you'll need to look at tidal stream atlases or the tidal information boxes that are often printed right on the chart. With that data, you can do a quick vector sketch on your chart to determine your course to steer (CTS). This is the heading you'll actually aim for on your compass to counteract the current and make sure you end up where you planned.
This kind of detailed planning is what keeps you out of trouble. It’s not unlike the off-season prep that keeps all your gear in prime condition. Just as you might learn how to keep mud off your ATV to protect your equipment, learning to account for set and drift protects your boat from the invisible forces of the water. Both come down to smart, proactive preparation.
Common Questions About Reading Nautical Charts
As you start spending more time with nautical charts, you’ll find that a few common questions always seem to surface. These aren't just for beginners; even salty, experienced mariners need a refresher on these details now and then.
Getting these fundamentals locked down is how you move from just looking at a chart to truly understanding it. Let's tackle some of the most frequent questions I hear.
How Do I Know if My Chart Is up to Date?
This is, without a doubt, one of the most critical safety questions you can ask. Sailing with an outdated chart is like driving blindfolded.
To check your chart, find the edition date, which is always printed in the chart's title block. Official hydrographic offices, like NOAA in the U.S., issue weekly "Notices to Mariners" that list every single recent change.
These corrections aren't trivial. They can include things like:
- A major channel buoy has been moved or its light is out.
- A new, dangerous wreck or obstruction has been found.
- Sandbars and channels have shifted after a storm.
It's your job as the skipper to apply these updates to your paper charts. Always start your voyage with the latest edition and make sure all the relevant notices have been marked before you even think about leaving the dock.
What Is Chart No. 1 and Why Do I Need It?
Here’s the best way to think about it: U.S. Chart No. 1 is the official dictionary for the language of nautical charts. It isn't a map you can navigate with. Instead, it’s a reference guide published by NOAA that decodes every symbol, abbreviation, and term you’ll ever come across.
It's completely unrealistic to memorize every symbol for every type of rock, wreck, or light characteristic. Having a copy of Chart No. 1 (or the international version) on board isn't just a good idea—it’s essential for correctly interpreting what the chart is telling you.
Key Takeaway: You wouldn't try to read a book without knowing the alphabet. You can't read a chart properly without Chart No. 1. It translates all that dense symbology into plain English, so you never have to guess what something means.
What Is the Difference Between a Raster and a Vector Chart?
Once you step into the world of electronic navigation, you'll run into two main types of digital charts. They look similar at a glance, but they work in fundamentally different ways.
-
Raster Charts (RNC): These are basically just digital scans or photos of traditional paper charts. The upside is that they look familiar. The big downside? When you zoom in, they get pixelated and blurry, just like a low-resolution picture. You can't click on individual symbols to get more information.
-
Vector Charts (ENC): Think of these as "smart" maps. They're built from a database of individual objects. You can zoom in almost infinitely and the detail stays crisp. More importantly, you can tap on any object—a buoy, a lighthouse, a hazard—and a box will pop up with critical information like its name, light pattern, or fog signal.
Vector charts are the foundation of all modern electronic chart displays (ECDIS) because they're so much more interactive. Still, many sailors appreciate the simple, big-picture overview that a raster chart provides.
Can I Rely Solely on Electronic Charts?
While your GPS and chartplotter are amazing tools, relying on them 100% is a rookie mistake that can get you into serious trouble. Electronics fail. It's not a question of if, but when.
A power loss, a software bug, a GPS signal outage—any of these can turn your fancy screen into a useless piece of plastic in an instant.
Paper charts are your non-negotiable, foolproof backup. Beyond that, the physical act of plotting a course on paper gives you a much deeper sense of situational awareness. It forces you to engage with the "big picture" of your voyage in a way that’s often lost when you’re just zoomed in on a tiny screen. The most proficient and safest mariners use both paper and electronics together.
Keeping your vessel in top shape, from understanding its charts to maintaining its hull, is the cornerstone of safe and enjoyable boating. For all your maintenance needs, from cleaning supplies to anchoring gear, Better Boat provides premium, easy-to-use products to protect your investment. Explore our full range of solutions at https://www.betterboat.com.
Related Posts

How to Polish a Boat for a Mirror Finish | Expert Tips

DIY Guide to Repair Vinyl Boat Seats
